Unit 6 FRQ (Simple Harmonic Motion) Answers
3 min read•november 29, 2021
AP Physics 1 🎡
257 resourcesAP Physics 1 Free Response Question Answers for Simple Harmonic Motion
Setup
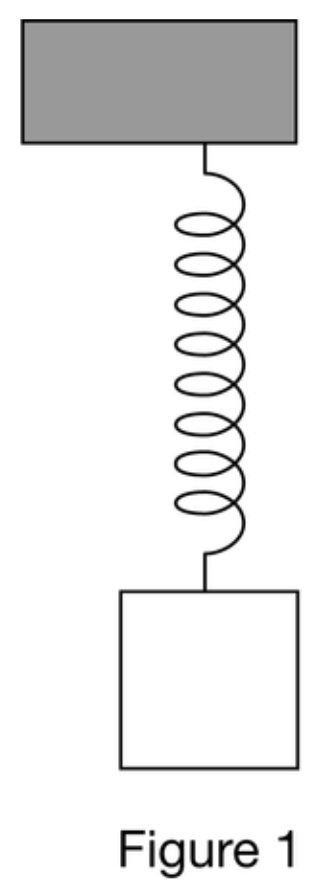
Figure 1

Table 1
| M (kg) | T (s) |
| 0.3 | 0.77 |
| 0.6 | 1.07 |
| 0.9 | 1.29 |
| 1.2 | 1.50 |
Questions with Answers & Rubric
Part A
(i) Indicate below which quantities could be graphed to determine the spring constant of the spring by using a best-fit line. You may use the remaining columns in the table above, as needed, to record any quantities (including units) that are not already in the table. (1pt)
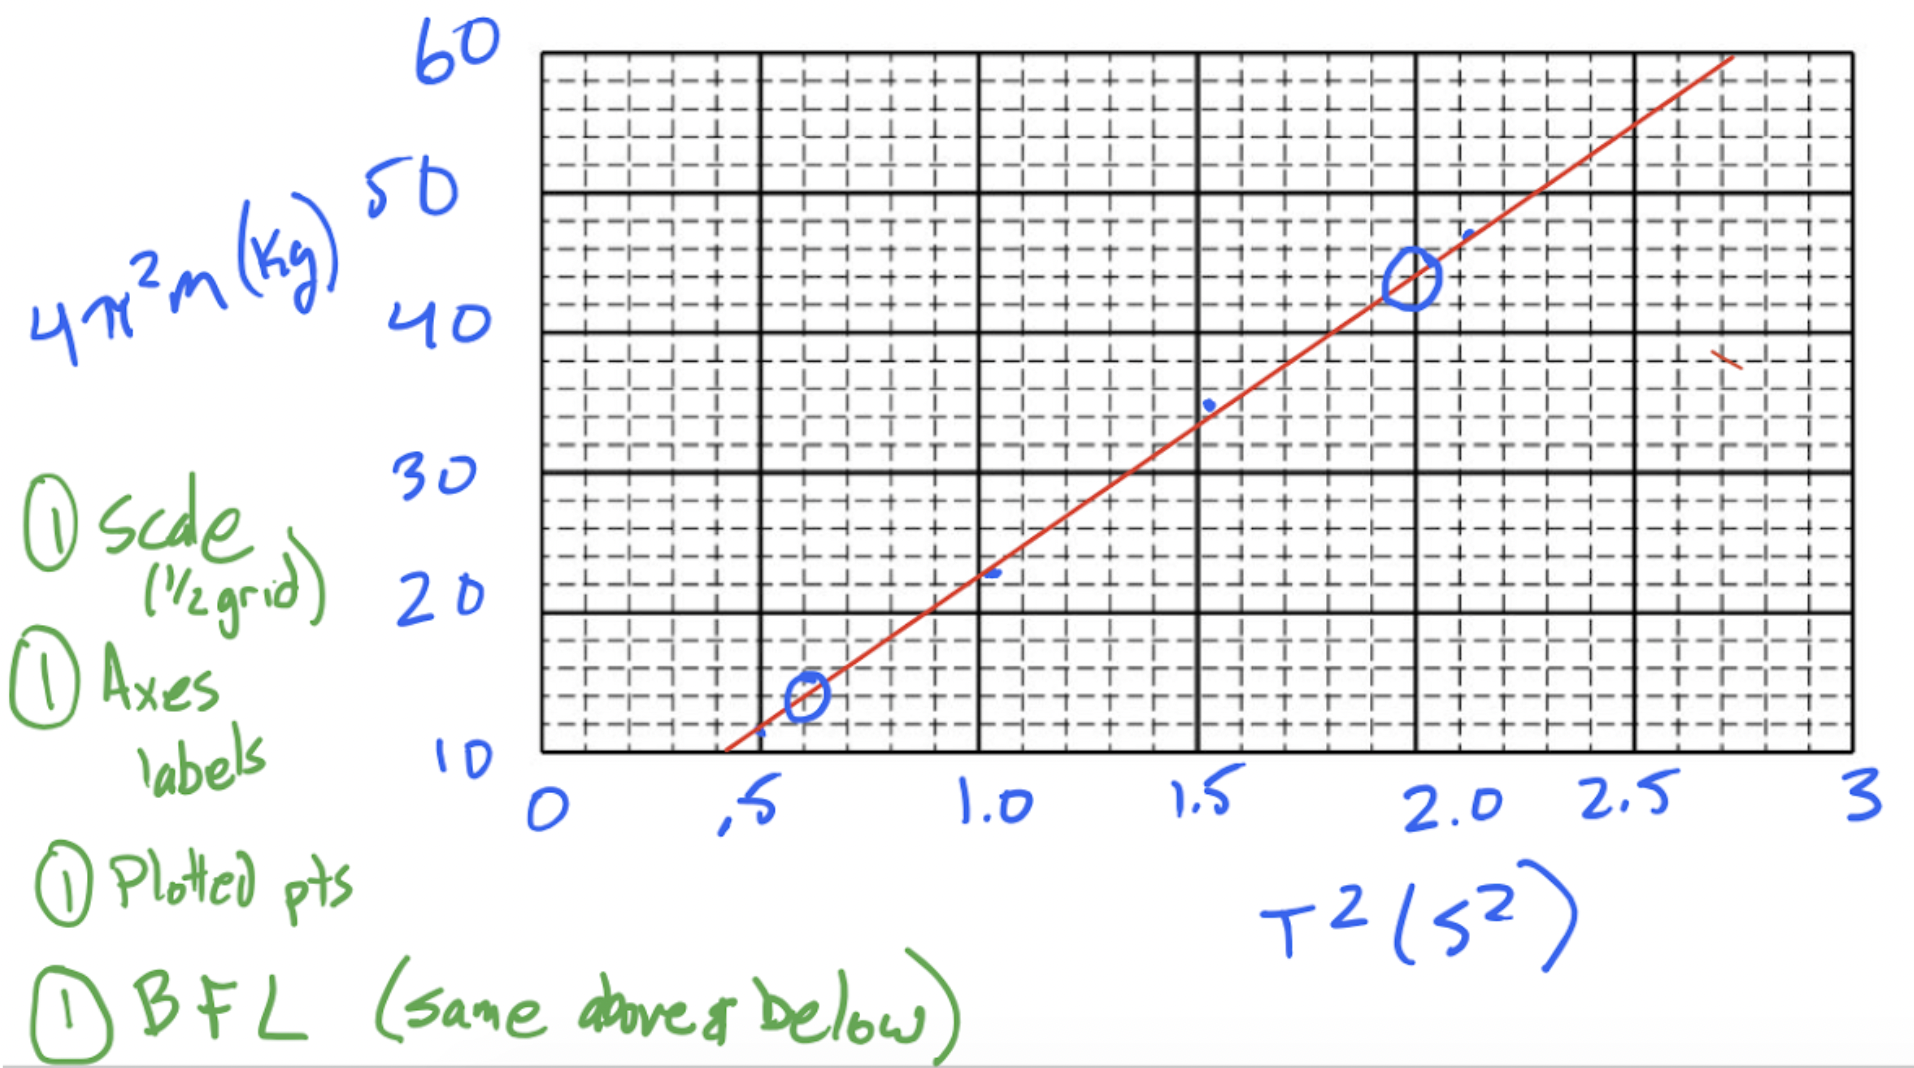
- 1pt: Vertical Axis: 4 * π^2 * m, Horizontal Axis: T^2

| M (kg) | T (s) | y = 4 * π^2 * m | x = T^2 |
| 0.3 | 0.77 | 11.8 | 0.5 |
| 0.6 | 1.07 | 23.7 | 1.14 |
| 0.9 | 1.29 | 35.5 | 1.66 |
| 1.2 | 1.50 | 47.3 | 2.25 |
- Study Guide: Period of Simple Harmonic Oscillators
(ii) On the grid below, plot the appropriate quantities to determine the spring constant of the spring by using a best-fit line. Clearly scale and label all axes, including units as appropriate. (4pts)

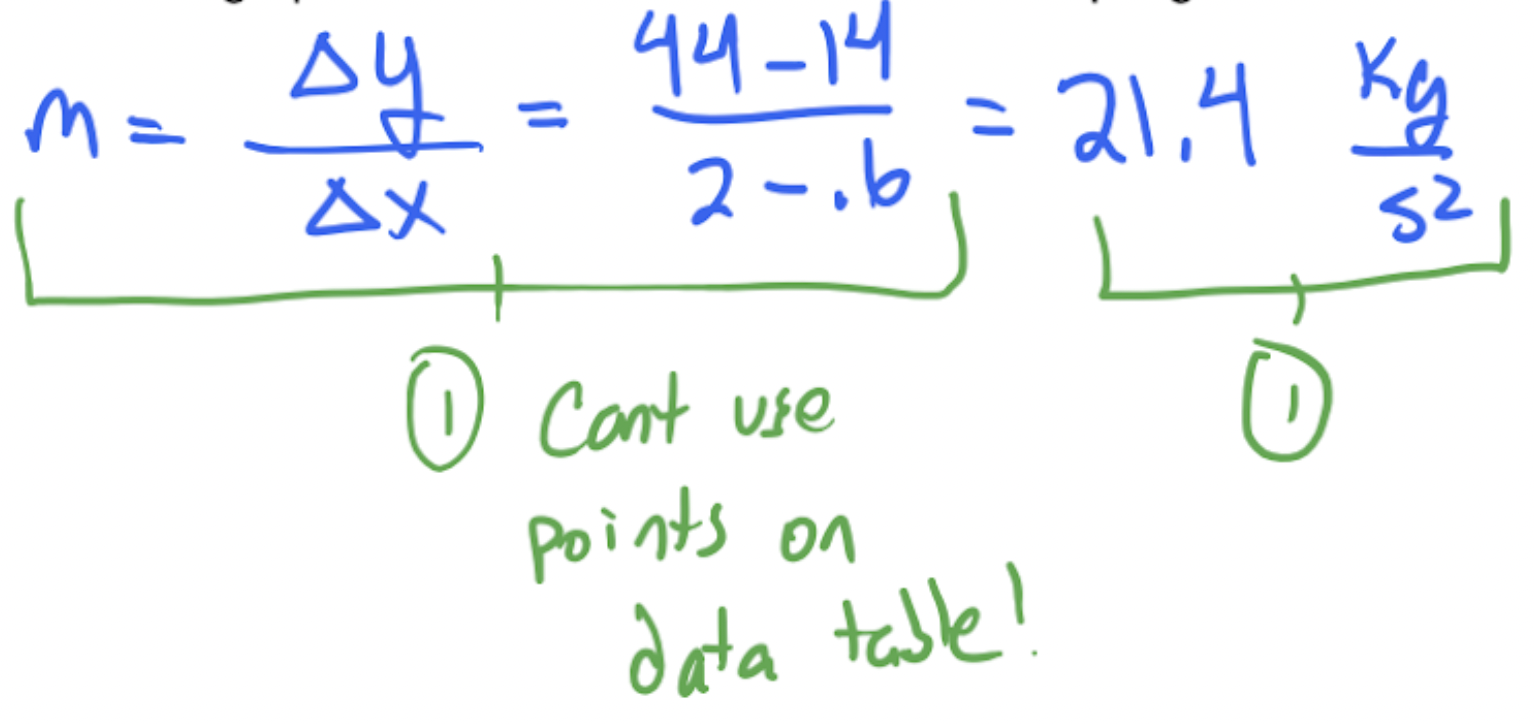
(iii) Use the graph above to estimate a value for the spring constant of the spring. (2pts)

Part B
(i) Will this change in the experiment affect the value of the period of oscillation T for the block-spring system compared to the situation from part (a)? Briefly state your reasoning. (4pts)
- 1pt: No
- 1pt: T = 2π * sqrt(m/K)
- 1pt: The block is now horizontal, but the mass and spring constant are still the same.
- 1pt: From the equation, since gravity and amplitude don't matter, and since the mass and spring constant are the same, the period will not change.
Part C
(i) Describe an experimental procedure to determine whether or not the period of oscillation T for the block-spring system is different compared to the situation from part (a). Include any steps necessary to reduce experimental uncertainty. Give enough detail so that another student could replicate the experiment. As needed, include a diagram of the experimental setup. Assume equipment usually found in a school physics laboratory is available. (5pts)

- 1pt: Diagram above
- 1pt: Pull back the block so the stretch is 0.8m (measured by a meterstick).
- 1pt: Let go and time 10 oscillations (with a stopwatch).
- 1pt: Compare this period to the period found in (a)
- 1pt: Complete the results and average the resulting periods.
Next Steps
- 🧠 Want to continue reinforcing your knowledge of Unit 6? Check out Unit 6 Trivia, either as a document or as a game.
- 📚 Want to review multiple units? Check out all of the AP Physics 1 FRQs.
- 🤝 Got more questions? Want to help others studying the same topic? Jump into a room in Hours!

© 2023 Fiveable Inc. All rights reserved.