AP Stats Mixed Units Practice FRQ #4 & Feedback
4 min read•january 5, 2021
Jerry Kosoff
Jerry Kosoff
AP Statistics 📊
265 resourcesSee Units
Practicing with FRQs is a great way to prep for the AP exam! Review student responses for a FRQ combining multiple units and corresponding feedback from Fiveable teacher Jerry Kosoff.
The Mixed Units FRQ
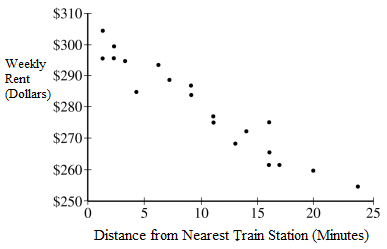
A researcher in a city with a large public train system wondered if the rent prices of one-bedroom apartments was related to the distance from the nearest train station. From a list of 250 similarly-sized one-bedroom apartments in the city, the researcher selected a simple random sample of 20 apartments. The researcher then measured the walking distance, in minutes, to the nearest train station and created a scatterplot comparing the walking distances to the advertised weekly rent, in dollars. A scatterplot and the output from computer regression software are shown below.


a. Explain a procedure by which the researcher may have selected the simple random sample.
b. Describe the association between walking distance from the nearest train station and weekly rent for the apartments included in the sample.
c. Interpret the value of the coefficient of determination (r-squared) in the context of this problem.
d. Before examining the data, a second researcher makes a prediction that for each additional minute of walking distance, the weekly rent will decrease by approximately $2. A 95% confidence interval for the slope of the regression line is constructed from the data, and is found to be (-2.471, -1.845). Does the confidence interval contradict the researcher’s claim? Justify your answer.
e. The second researcher wants to conduct a similar study to the first researcher. However, in the second researcher’s study, a mixture of one, two, and three-bedroom apartments were selected. Do you expect the value of r-squared for the second study to be greater than, less than, or equal to the value of r-squared in the first study? Justify your response.
FRQ Writing Samples and Teacher Feedback
Student Response 1
a. The researcher could have assigned each apartment in the sample a number from 1-250 and used a random number generator to choose 20 apartments, taking out any repeats.
b. There is a strong, negative linear correlation between the weekly rent and distance from the nearest train station. (should I say correlation or association?)
c. 92.1% of the variability of in the weekly rent dollars can be accounted for by the variability in the distance from nearest train station.
d. No it does not, because $2 falls within the given confidence interval.
e. I expect the r-squared value to be less than the first study. This is because r will decrease since there will be lower residual because there will be an increased variability in the weekly rent since it can differ depending on the number of bedrooms. If r decreases, r squared decreases as well.
Teacher Feedback
Little things: in (a), you must specify that the 20 numbers should be contained within the interval of 1-250 (you’re leaving yourself open to other numbers the way you phrase it).
In (b), either word is ok - correlation or association. I tend to use the language that is included in the question to play it safe.
c, d, and e give fully appropriate explanations!
Student Response 2
a. The researcher could have numbered the 250 similarly-sized apartments from 1-250 and wrote the numbers on an equally sized piece of paper. Then, the researcher could put these slips in a hat and she it very well. Then the researcher can pick 20 slips of paper which would represent the 20 apartments that will be used in the sample.
b. The association between walking distances from the nearest train station and weekly rent for the apartments included in the sample is strong, negative, and linear with no suspected outliers. It is strong as the correlation coefficient= square root of r^2 = square root of .921 is .9596 which shows us that the data points follow a strong pattern and linear pattern. We know the data points have a negative association as the slope of the linear regression line is -2.158.
c. The coefficient of determination, says that 92.1% of the variation in weekly rent is accounted for by the regression line when x= distance from nearest train station.
d. Since the confidence interval contains -2, the researchers claim is not contradicted.
e. We expect the r-squared to be less than the first study. This is because we will have more variability in the weekly rent since there are more types of apartments which vary in weekly rent. This leads us to have less of an association between the weekly rent and the train station.
Teacher Feedback
Nicely done!
Browse Study Guides By Unit
👆Unit 1 – Exploring One-Variable Data
✌️Unit 2 – Exploring Two-Variable Data
🔎Unit 3 – Collecting Data
🎲Unit 4 – Probability, Random Variables, & Probability Distributions
📊Unit 5 – Sampling Distributions
⚖️Unit 6 – Proportions
😼Unit 7 – Means
✳️Unit 8 – Chi-Squares
📈Unit 9 – Slopes
✏️Frequently Asked Questions
✍️Free Response Questions (FRQs)
📆Big Reviews: Finals & Exam Prep

© 2023 Fiveable Inc. All rights reserved.